THE PLAYGROUND
See what your data
can tell you.
Data Studio. Google Sheets. Metabase.
Start with a sample. Make it your own.
Best explored on a desktop or larger screen.
Your next question starts here.
Explore a sample. Bring your own numbers.
02 / EXPLORE THE DASHBOARD
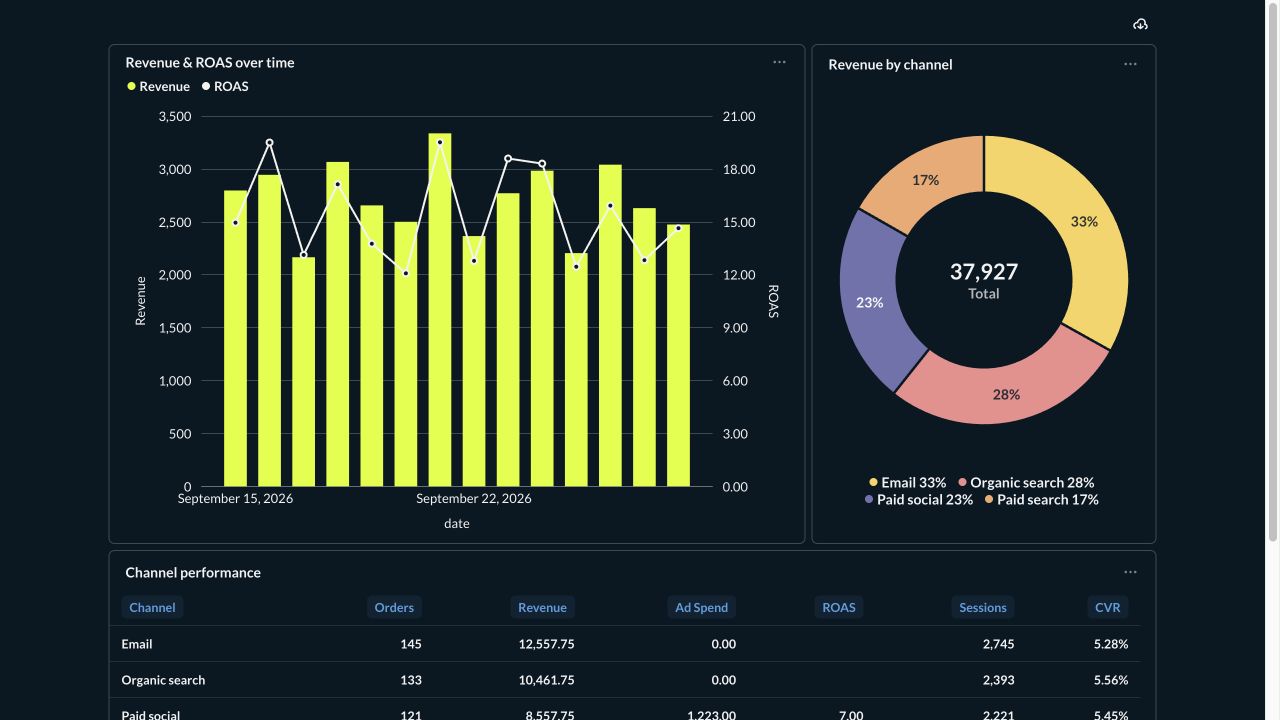
Ecommerce performance
- Revenue
- —
- Orders
- —
- Ad spend
- —
- ROAS
- —
Expanded chart
Need this built around your business? Plan your reporting project
SAMPLE DATA
Ecommerce in Data Studio
Try the date and channel filters. To use your data, open the template, make a copy and connect your source.
Preview not visible? Open in Data Studio ↗. Use your Google account to make a copy.
Use your own data
- Open the template and choose Make a copy.
- Connect your own CSV or Google Sheets data source.
- Match the sample fields and check the dates, ROAS and CVR.
Use one daily total per channel. Your file stays in the Google source you choose; this preview uses sample data.
Download sample CSV ↗SAMPLE DATA
Ecommerce in Google Sheets
A dashboard you can keep. Make a copy, replace the sample rows in Data and choose your dates and channel.
SAMPLE TEMPLATE
The template is ready to explore.
Open the sample dashboard in Google Sheets. Its embedded preview is not enabled yet.
Open Google Sheets ↗Read-only sample. To change dates, channel or data, make your own copy.
Use your own data
- Choose Make your own copy.
- Replace the sample rows in Data, keeping the six column headings.
- Set the date range and channel on Dashboard.
Use one daily total per channel. This starter supports up to 10,000 rows, the four sample channels and charts up to 31 selected days. Copies belong to your Google account.
Download sample CSV ↗SAMPLE PREVIEW